

Sustainability report and annual report design
Good design helps investors, clients, employees and public bodies find what they’re looking for quickly and trust what they read.
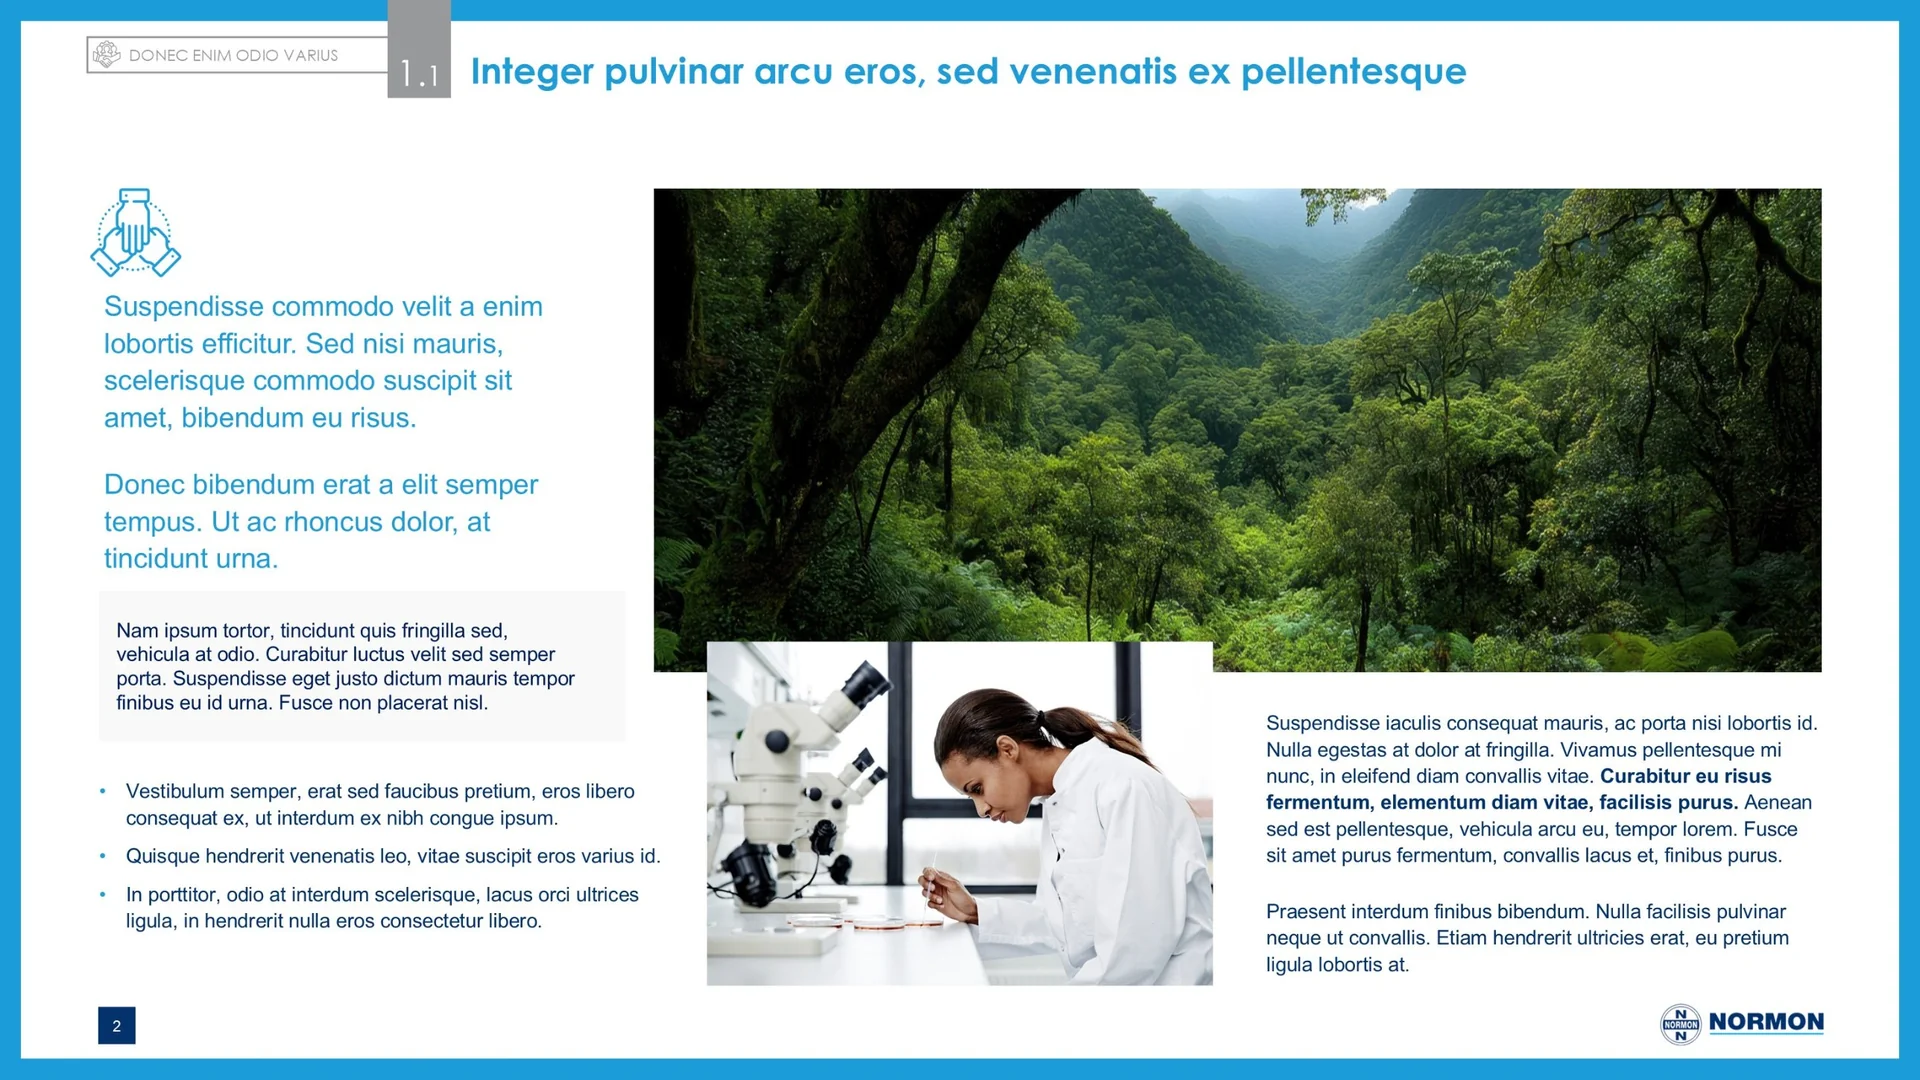
A sustainability report or annual report brings together everything your company has achieved over the year in one document: results, environmental and social impact, corporate governance and future commitments. We design sustainability reports and annual reports that organise all that information into a clear, on-brand document that’s a pleasure to read.
Sustainability data people understand
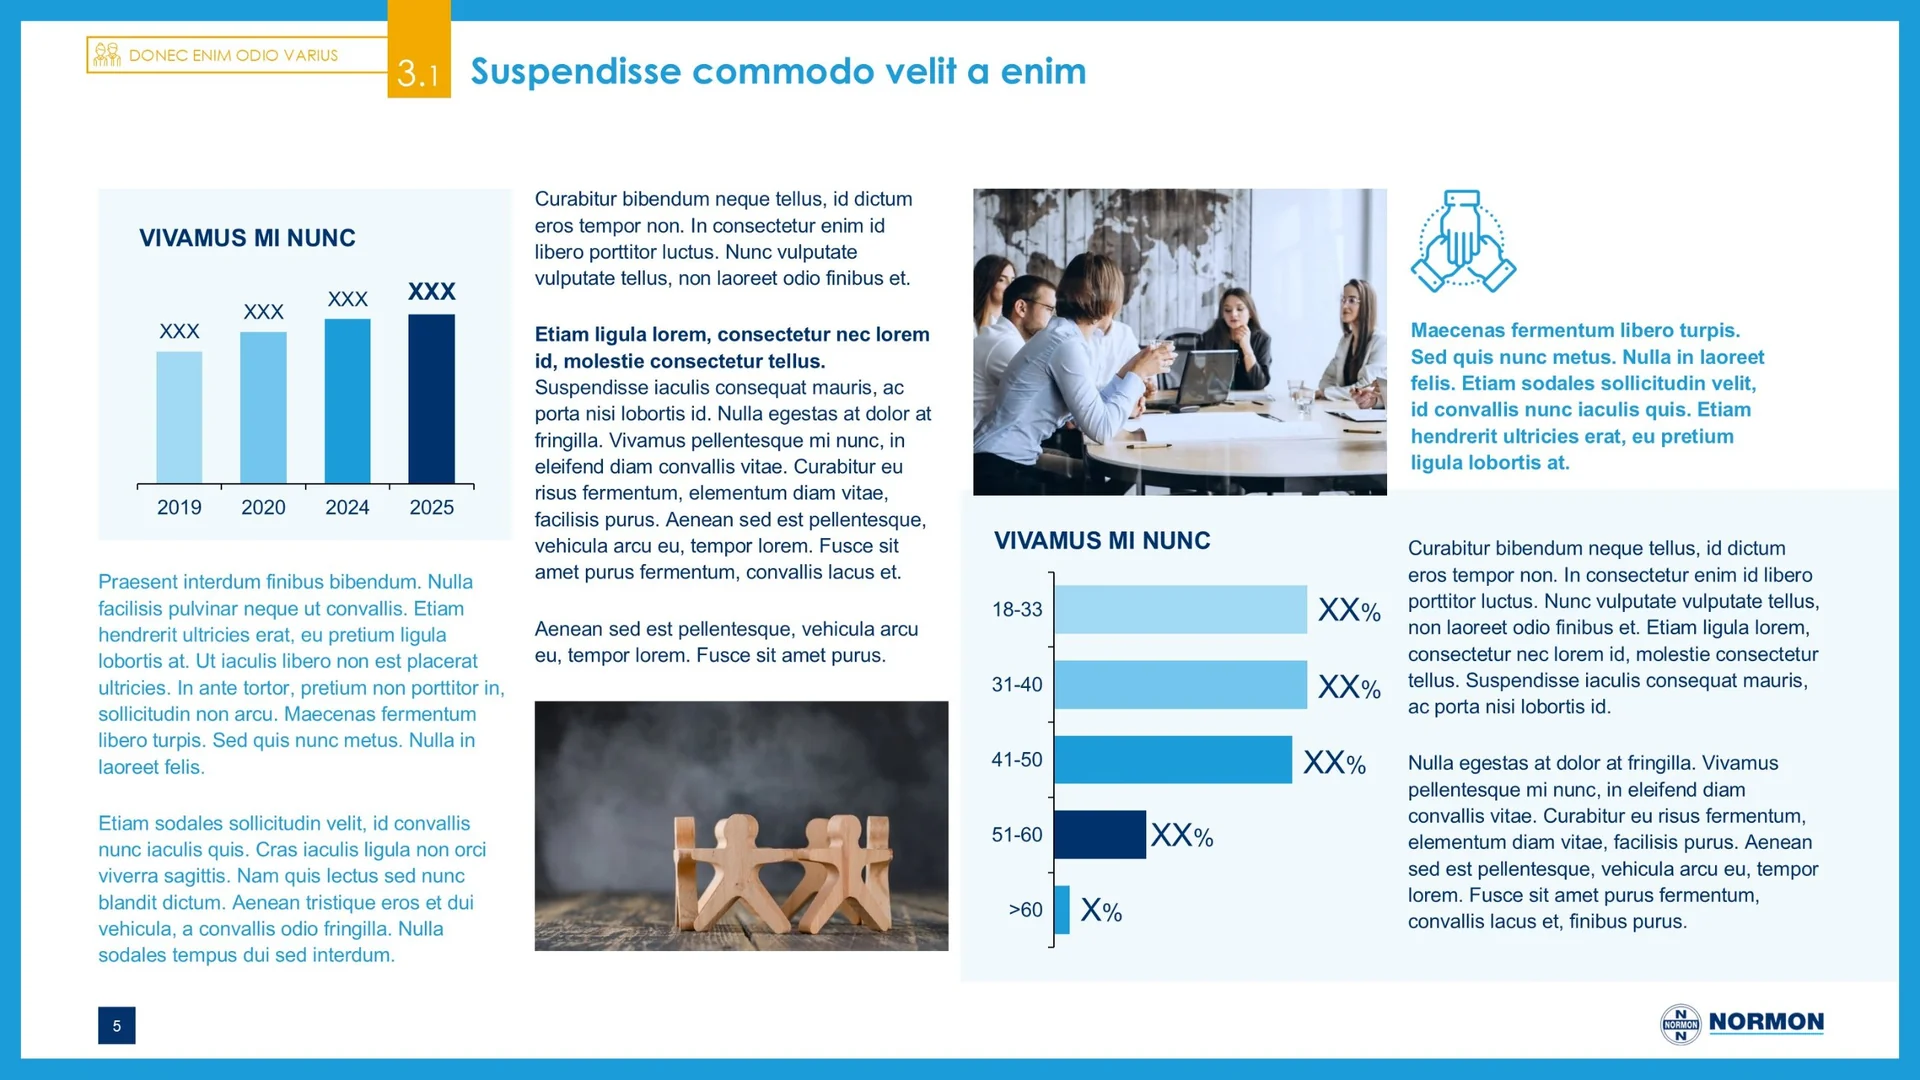
Sustainability reports are packed with indicators: emissions, energy use, diversity, training and supply chain. We work on every figure so it can be read at a glance, with clean charts, infographics and a visual hierarchy that brings the key data forward and keeps the detail close at hand for anyone who needs it.
An annual report in your brand’s style
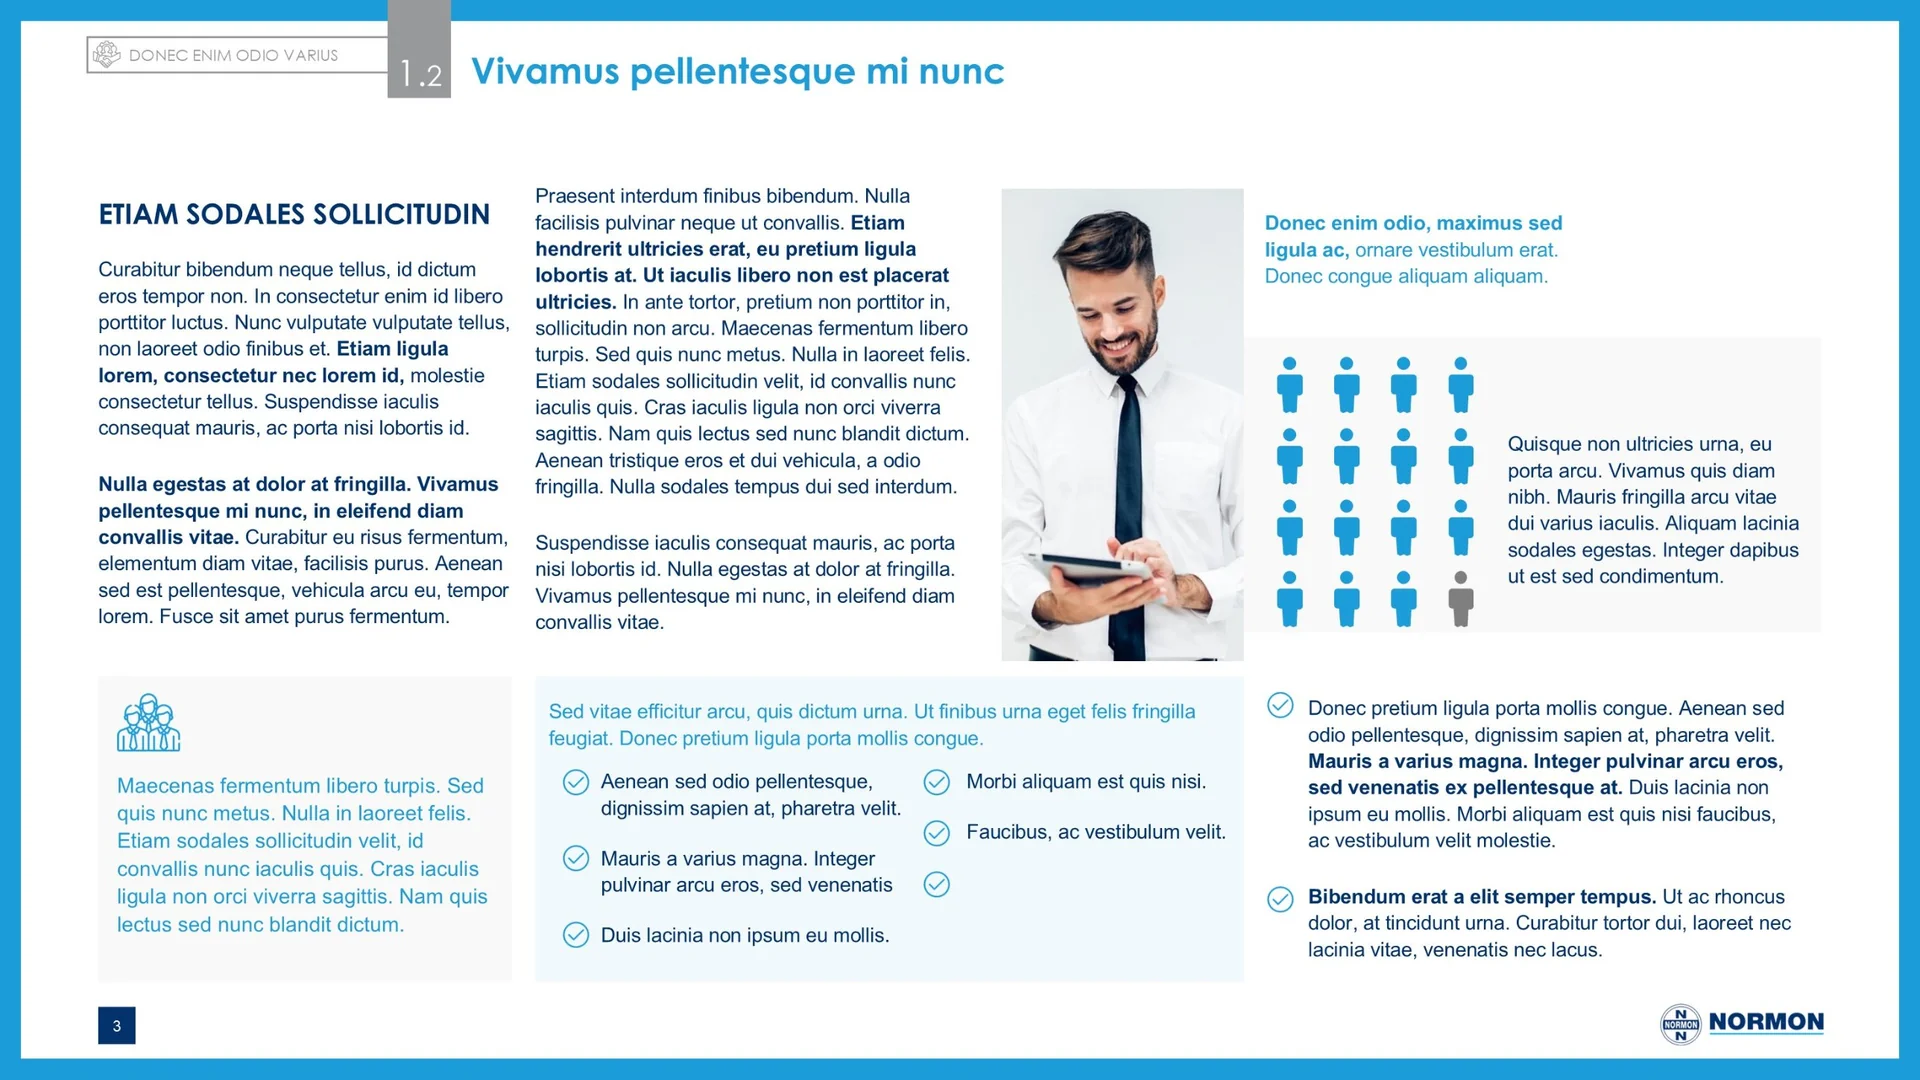
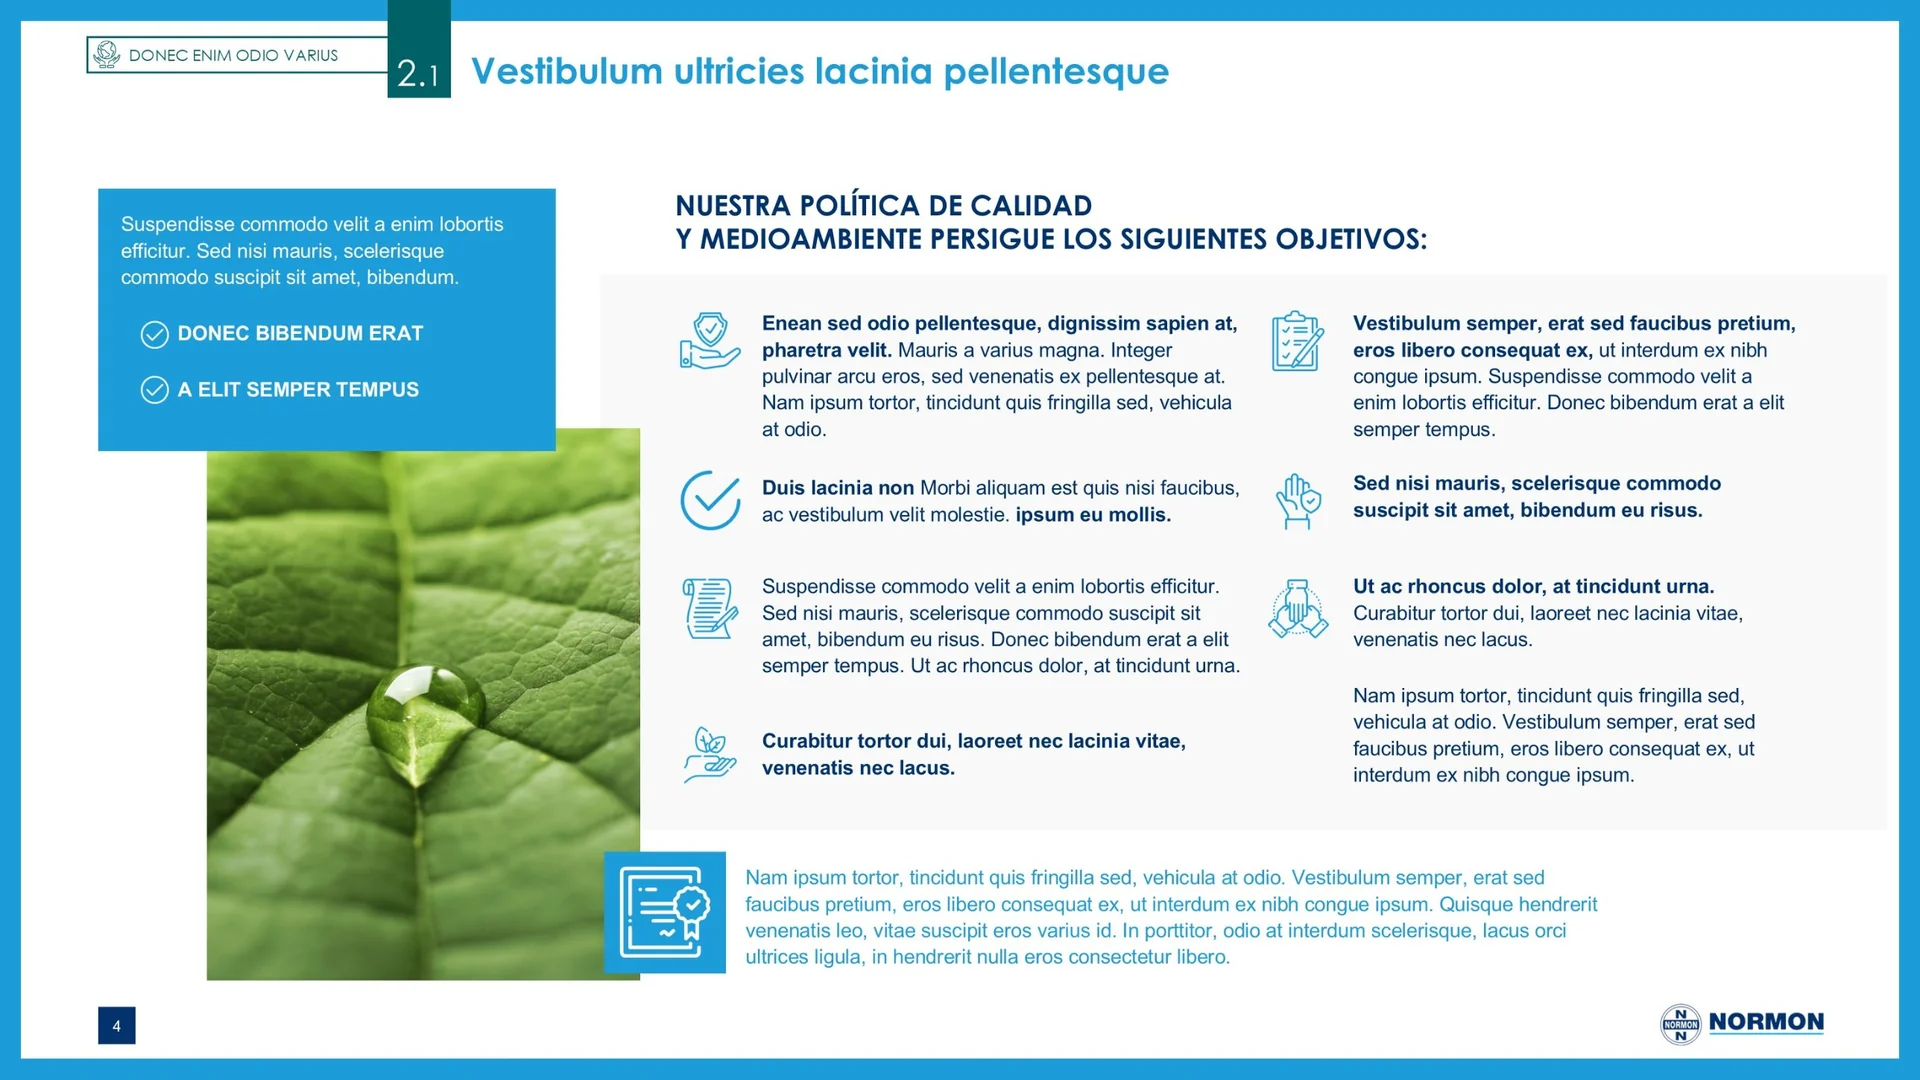
Your annual report is one of the pieces that best represents your company. We apply your corporate identity to every page and build a layout system that keeps everything consistent from start to finish.
An interactive report you navigate like a website
Making a sustainability report easy to read is essential, and flawless on-brand design alone won’t get you there. If readers get lost between pages and struggle to find what they need, the report loses impact and your company’s image suffers. That’s why we recommend making these documents interactive, with a clickable contents page, buttons and links between sections, so readers can move through them like a website and reach any figure in one click.
What we design
- Sustainability and corporate social responsibility (CSR) reports.
- Annual reports and results reports.
- ESG and non-financial reports.
- Executive summaries and short versions to share the key figures.
- Infographics and charts for your website, social media and presentations, drawn from the report itself.
If you’re working on this year’s report, tell us where you are with it and we’ll help you make it as clear as it deserves to be.